MTT Variance and Bankroll Calculator Online: What It's For and How to Use It
Tournament players often go through hundreds of MTTs without turning a profit, even when playing well. Even skilled players with a positive expected ROI can go through long losing stretches because tournament results are highly variable. An MTT variance calculator lets you see how much results can swing even when you hold a consistent edge over the field. Without understanding this, it's easy to mistake a statistically normal fluctuation for poor play.
We explain what an MTT variance simulator shows and why tournaments can produce large swings, especially in large fields with top-heavy payouts. We show you how to use the tool and how to interpret the results. Our goals: understand the risk of going broke and find out how many buy-ins are needed to play comfortably.
What the MTT Variance Calculator Shows
The tool is designed to estimate how much a player's results can deviate from expectation due to luck. The MTT variance calculator displays the likely dispersion of winnings and losses over a given volume of play. The tool uses a Monte Carlo simulation to generate possible results for the selected tournament volume and estimate their distribution.
Here's the useful information a poker tournament calculator provides after simulation:
- Expected profit: calculated based on ROI and the number of MTTs entered.
- Risk of ruin: the probability of losing your entire bankroll.
- Required reserve in buy-ins or cash.
- Typical MTT downswing: shows how far below the expectation line a player can fall.
- Confidence interval: A 95% interval shows the range containing 95% of outcomes in the simulation model; it does not guarantee that a real result will fall within that range.
The output data lets you see the full picture of bankroll swings: the depth of possible drops, the probability of a stretch in the red, and how much money you need to play comfortably. This information turns abstract luck into concrete, easy-to-understand numbers that can be calculated and roughly predicted.

What Is MTT Variance
The term refers to the mathematical measure of how actual results disperse relative to expected values. MTT variance takes on exaggerated proportions because of the payout structure. A player can display flawless strategy for a long time and still remain in the red simply due to a string of unfavorable runouts in key spots.
In cash games, every pot contested contributes more or less equally to overall winrate, while in MTTs the result of an entire month often depends on a handful of critical all-ins in the late stages. A single big score can offset hundreds of failed attempts, and conversely, a series of lost flips at final tables can erase months of work.
To stay calm during tournaments, it's important to understand where the sharp drops and spikes in results come from. It's not that you're making mistakes. These swings up and down are the essence of MTTs, a mathematical characteristic of the format. When you understand this, you stop blaming yourself and searching for problems in your game that don't actually exist.
What MTT Variance Depends On
Several interconnected parameters influence the final outcome:
- Field size: the more participants an event draws, the lower the probability of reaching the money and the bigger the potential prizes for a deep run. Large fields attract weak players and create massive guarantees, but the price for this is extreme result dispersion. Smaller tournaments offer more predictable dynamics, though they don't promise big payouts.
- Payout structure: a flat payout table reduces volatility, while a top-heavy one increases swings. Late-stage ICM pressure also influences variance, as tournament equity becomes compressed near the bubble and final table.
- Buy-in variation: more expensive events carry disproportionate weight in the overall graph.
- Blind level speed: turbo structures reduce the room to put your edge over opponents into practice.
These factors shape variance in poker tournaments and determine how comfortable play will be at a given skill level. Their combination requires its own analysis for each tournament schedule and chosen format.
How Variance Relates to MTT Bankroll
The size of your reserve directly defines your ability to weather inevitable downswings. An MTT bankroll needs to cover not just current buy-ins but also statistically expected stretches of bad luck. If the money isn't sufficient, even a mathematically profitable strategy can lead to ruin long before the edge has time to materialize.
For tournament and cash players, standard bankroll management recommendations differ significantly. Bankroll requirements depend on win rate, field size, payout structure, and acceptable risk of ruin; use a bankroll model suited to the tournaments you play rather than treating a fixed buy-in count as a universal minimum. An MTT bankroll calculator helps define your individual safety margin based on concrete parameters: ROI, average buy-in, and desired risk level.
Even with positive expectation, there's a chance that a losing streak will zero out your poker room balance. A properly sized bankroll reduces that chance to an acceptable level. Ignoring this principle is one of the main reasons promising tournament players end their careers without ever seeing positive results.
Is It Possible to Reduce MTT Variance?
Eliminating swings entirely is impossible because they're an inherent property of the random distribution of cards. However, there are ways to make dispersion more manageable:
- Increase playing volume: over a larger sample, the average result per tournament tends to move closer to its expected value, although total profit can still fluctuate widely.
- Choose optimal field sizes: this helps maintain a good prize level without extreme downswing risk.
- Improve your skill: a higher ROI increases expected profit and can improve the chance of finishing a given sample in profit, but it does not necessarily reduce variance or the absolute depth of downswings. Developing ICM skills for final-table play helps convert deep runs into bigger cashes.
Reducing tournament variance is a complex task that requires discipline, smart game selection, and constant evolution. Working on strategy and reviewing mistakes increases your edge over the field, which in the long run makes swings less painful.
How to Use the Calculator
Now let's explain how to use this free MTT calculator. Similar services already exist online, but this tool is designed for professional players who compete in dozens of MTTs per day.
The simulation uses the Monte Carlo method. The program doesn't calculate from formulas: it simulates a quantity of tournaments with the defined parameters. Each run generates a random finish for the player. Based on this, the result over the playing volume is calculated. On the home screen, you see several templates. For example: during the week, freezeouts and reentries in small fields; on weekends, knockouts with many participants. This lets you estimate potential profit and risks over a week or a month.
When you change any parameter (number of tournaments, average buy-in, ROI, etc.), the output updates:
- Result.
- Chance of finishing the volume in profit.
- Probability of ruin.
- Bankroll needed to play without risk of ruin.
You can choose to display the information in cash or buy-ins. The option is in the upper right corner.
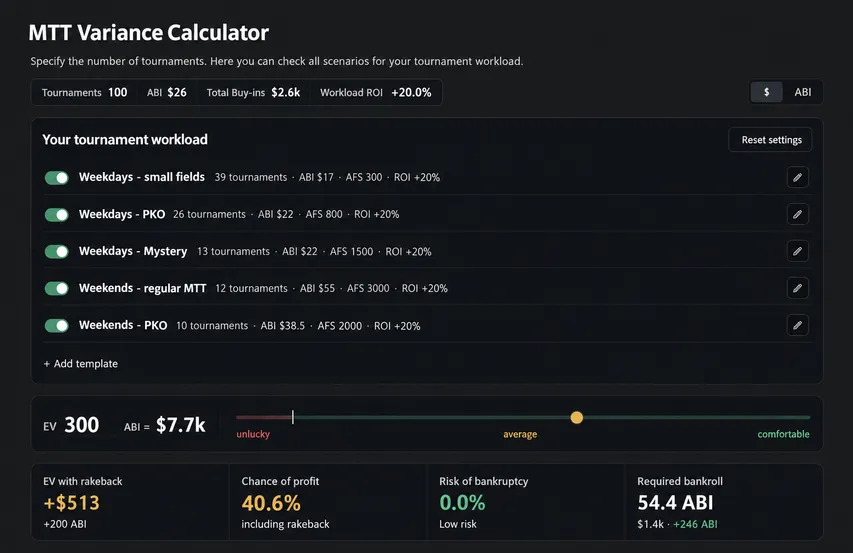
The templates are set up for typical MTT groups. In each one, you can define several parameters:
- Format (freezeout, reentry, knockout, etc.).
- Number of planned tournaments.
- Buy-in value without rake.
- Rake, entered separately.
- Expected MTT ROI.
- Average field size (AFS).
- Percentage of participants reaching the money.
- Payout structure (standard, flat, or top-heavy).
You don't have to use all the templates. You can disable several or leave just one.

Most players aren't professionals and play about two days a week. In this case, detailed volume planning isn't necessary. For the recreational player, it's enough to understand risk of ruin and know the required bankroll size. We'll show how to use the calculator for those who play irregularly.
First, disable all templates except one. Edit its name. Then enter your bankroll in the "BR" field at the bottom. It's more convenient to indicate the cash value than average buy-ins.
In the remaining template, enter the average parameters of the events you play. A setup like this already works well:
- 1,000 tournaments.
- 20% ROI.
- "Normal" format, meaning freezeout.
- $11 buy-in: $10 net entry + $1 fee.
- Field size (AFS): 500.
- Payout: "Standard".
- 15% of participants in the money.
A common beginner question: where do you get the MTT ROI value? It's defined by your previous results. If you don't have a reliable ROI estimate, treat any assumed value as a scenario input rather than a typical-player benchmark. Without your own data, you might enter a conservative value, for example 10%.
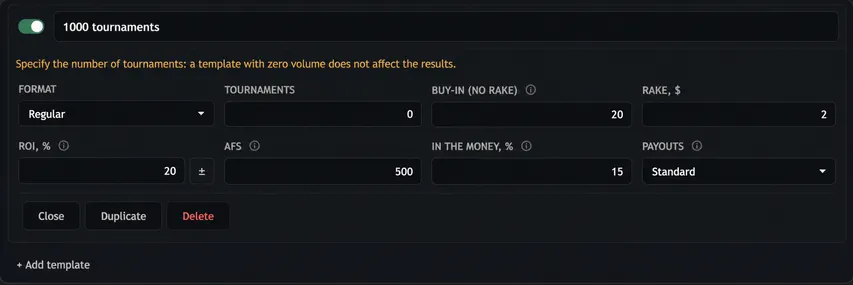
With every parameter change, the calculator recalculates instantly. You don't need to click any button to run simulations.
We set a bankroll of 100 buy-ins, meaning $1,100 in cash. The program showed the following numbers:
- +$1,999: profit over 1,000 MTTs with $11 buy-in and 20% ROI.
- 79.7%: probability of finishing the volume in profit.
- 16.1%: chance of zeroing a 100 buy-in bankroll.
- 151 ABI: buy-ins needed to play without risk of ruin.
At the bottom of the page, a text summary with recommendations also appears.
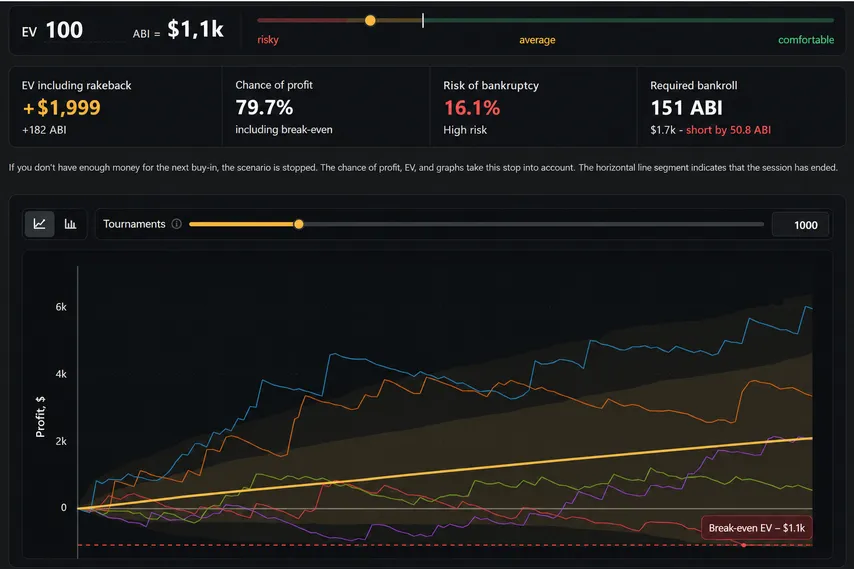
Besides the numbers, the program displays graphs of the results from five simulations of 1,000 MTTs. The ascending yellow line shows expected winnings (EV). Each curve corresponds to a different series. Move the tournament number slider to refresh the screen and see the results of five new simulations.
How to Use the Calculator's Results
The data obtained serves as a foundation for adjusting bankroll management and evaluating your own play realistically. If the simulation shows that with available capital the risk of ruin exceeds a comfortable level, it's worth increasing the reserve or temporarily lowering the buy-in.
The second application is psychological preparation. The poker variance calculator shows in advance how deep and long the losing streaks of a winning player can be. When the downswing happens in practice, it's not seen as a catastrophe or proof of incompetence, but as something statistically expected. This maintains clarity of thought and prevents tilt.
The third application is tournament schedule evaluation. By comparing different combinations, you can find a set that balances potential profit and swing level.
Conclusion
The MTT variance calculator transforms intuitive hunches into measurable values and allows you to make data-based decisions. When you start using this tool frequently, you'll have a more mature and conscious approach to your tournament career: emotions will give way to mathematical discipline.